
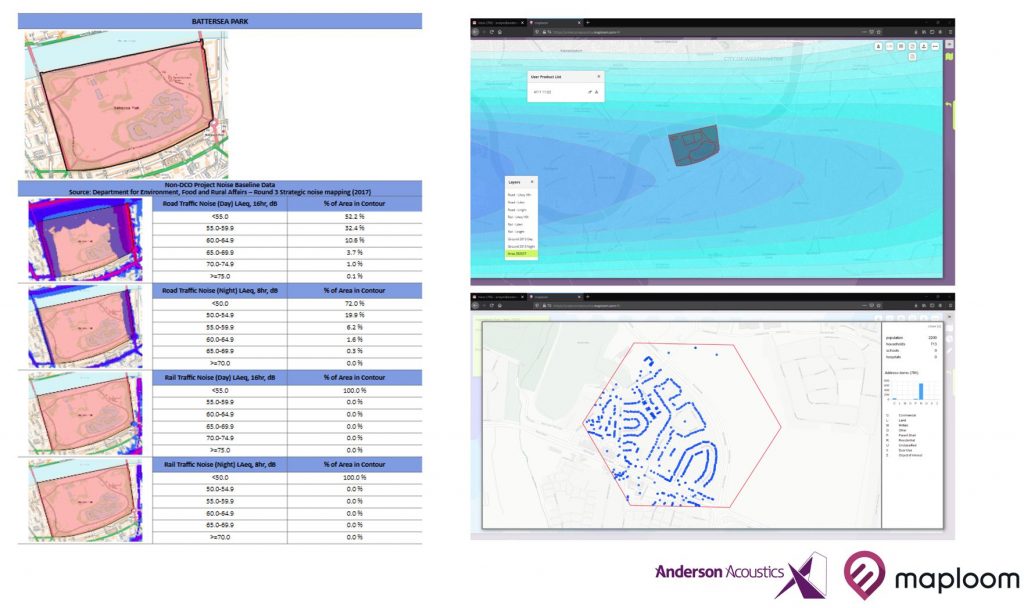
We have created a powerful noise mapping platform for Anderson Acoustics delivering insights into potential noise impacts through map based visualisation and automated reporting tools.
Accessible from anywhere, the online platform requires no specific software or hardware installation and allows users to securely login to the website in order to see a wide variety of noise data from modelling and surveys. Users can also use many other datasets such as contextual mapping, population data and protected sites.
The platform is able to generate a series of noise reports for user defined areas presented with maps and statistics and using a number of different templates. There are also interactive elements to enable real-time query of different noise levels and address profiles in a user friendly way.
Using Maploom over a traditional desktop GIS approach saved days of time and had the following benefits:
Speed – out-performs most commercial online GIS tools
SaaS – Software as a Service is available anywhere from a standard web browser
Simplicity and self service – enables users to directly access a wide range of mapping, visualization, analysis and reporting functions without the need for technical experts
Live – interactive views versus static content in reports
Automation – hundreds of different maps and statistics generated in seconds
Power – powerful analytical, visualisation and dashboarding tools
Branded – create automated reports with predefined templates and branding
Efficiency – reduces the amount of effort needed to create existing outputs, reducing costs
Flexibility – add your own data or call data from an external API
Export – data (GIS layers and spreadsheets) for more bespoke analysis