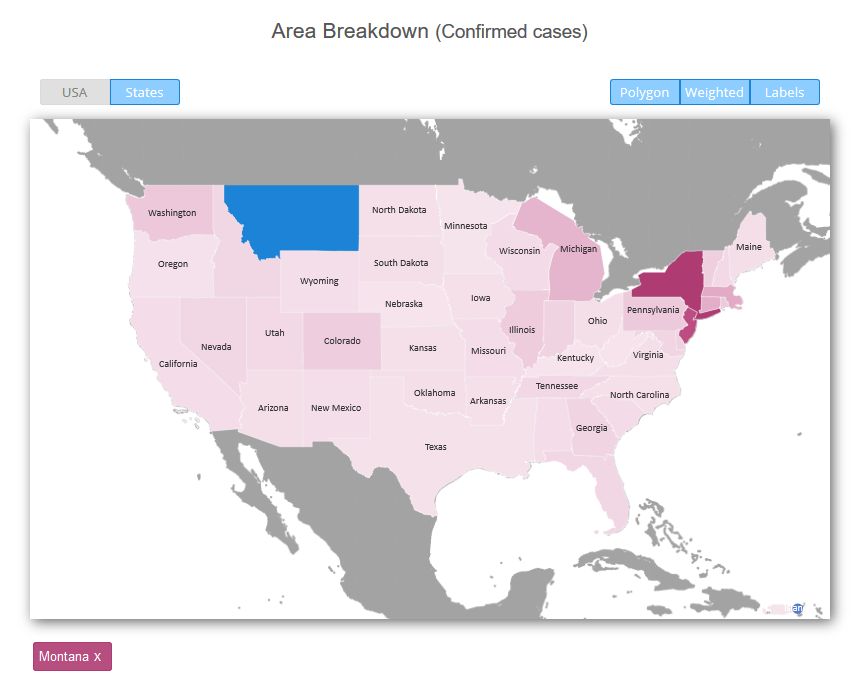
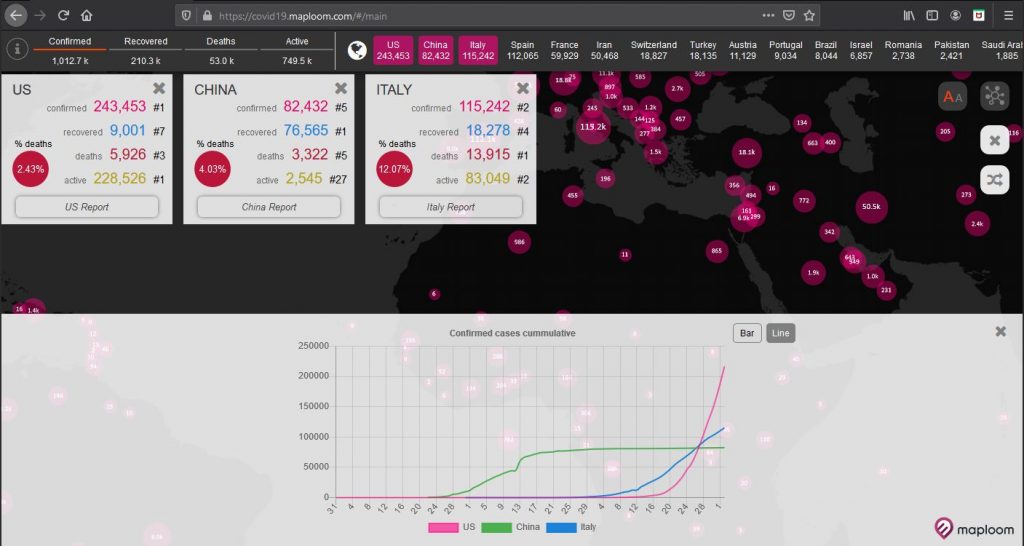
In order to help visualise and understand the spread of the Coronavirus COVID-19 pandemic we are running a pro bono project utilising our platform and have created an Interactive Map that allows you to interrogate the pandemic data in a number of different ways. This includes the ability to select specific countries and compare the progerssion of the virus.
Using data collated by Johns Hopkins University and from specific country sources, we have created an interactive map with graphs and other data visualisation elements.
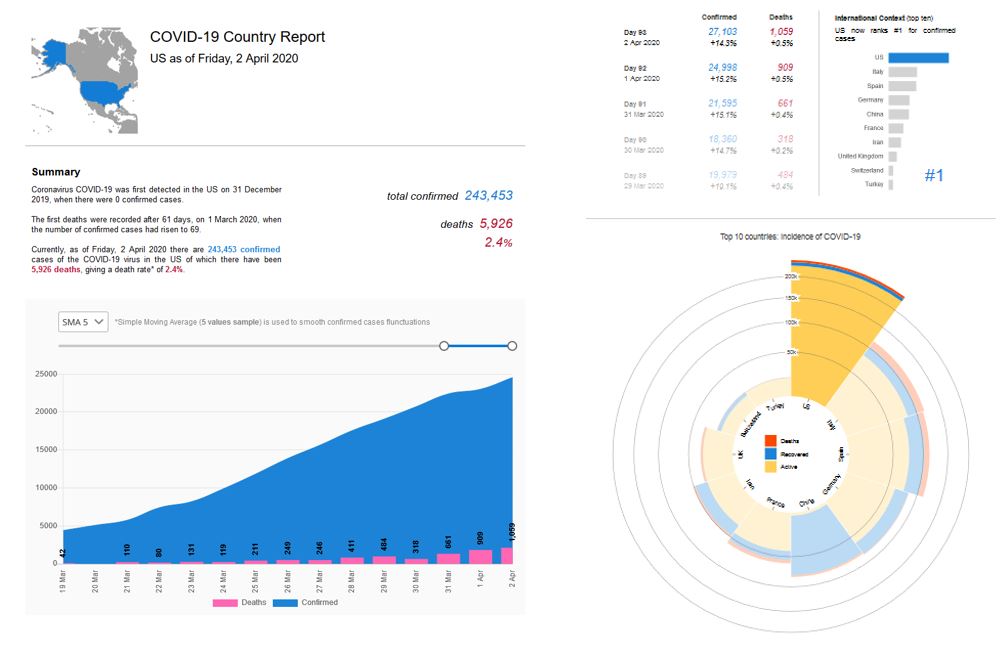
We are updating the data each day and adding new tools and visualisations to the site. Let us know how we can help and if you would like further information or you have data you wish to contribute, please contact us. We recently added Specific country reports to the site (as shown below).